Gender-based analysis of Breast Cancer - Part I
Posted on Thu 14 May 2020 in Data Science
Breast cancer is one of the two most common cancers reported worldwide in 2018 among both the genders. Along with lung cancer, breast cancer accounted for 24.6% of all the cancers 1. As the name suggests, breast cancer is cancerous growth of cells in the breast. As both women and men have breast tissue, it is found in both, although it is rare in men. In this blog post, I address the question of gender specific survival among breast cancer patients.
For this analysis, I have obtained cancer data from the SEER (Surveillance, Epidemiology and End Result) program of the National Cancer Institute. The SEER program collects and publishes cancer related data from cancer registries that covers about 35% of the US population. The variables in this data can be broadly classified into demographic variables, e.g., age, gender, marital status, and location; tumor attributes, e.g., grade and stage; treatment, e.g., surgery; and outcome, e.g., survival time, dead or alive, and cause of death. The data used in this blog post is from 1975-2016 2.
Gender difference in age at breast cancer diagnosis
Considering individually male and female breast cancer records, there were 11,288 male breast cancer cases and 1,685,890 female breast cancer cases, indicating about 0.7% of all breast cancer cases are for men. I found that the mean age at diagnosis for women is about 61.3 years while for men it is about 66.4 years, implying a significant age difference of 5.05 years (p-value < 0.001). This delay in diagnosis is often associated with lack of awareness among men about male breast cancer.
Gender differences in tumor-specific variables
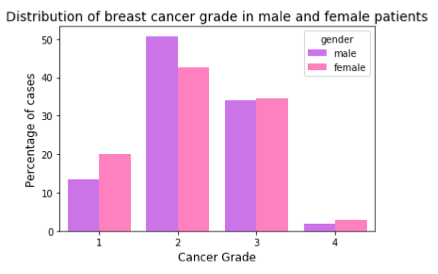
The first attribute I checked for was tumor grade. Tumor grade is the degree of differentiation of tumor cells and organization of the tissue. If the tumor tissue is differentiated and the tissue organization is close to normal tissue, the tumor grows and spreads slowly. On the other hand, if the tumor tissue is undifferentiated or poorly differentiated and its organization is farther from normal appearance of healthy tissue, it grows and spreads faster. Tumors are classified based on their grades. Grade I is well-differentiated, Grade II is moderately differentiated, Grade III is poorly differentiated and Grade IV is undifferentiated. There is a lower percentage of men with grade I and a higher percentage of men with grade II cancer compared to women. However, both men and women have fairly similar percentage for higher grades of cancer.
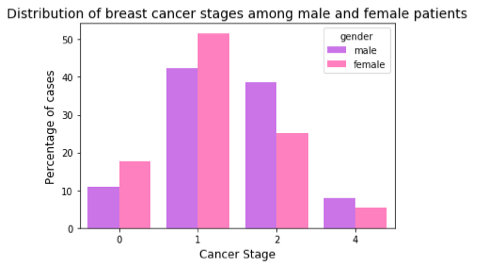
Next, I studied cancer stage, i.e., how far the cancer has spread. The SEER data encodes the stage at 4 levels, 0, 1, 2, and 4. In stage 0, the cancer is in situ (a non-invasive neoplasm). Stage 1 is localized (confined to the organ of origin), Stage 2 is regional (neoplasm spread to nearby organs and lymph nodes), and Stage 4 is distant (neoplasm spread to distant organs). While women reported higher percentage of cases with stage0 and stage1, men have higher percentage in higher stages.
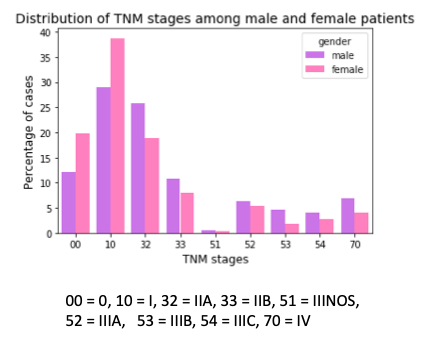
Another way of reporting cancer stages is by using the *TNM staging system, which is commonly used by medical professionals. It is based on 3 variables — the extent of tumor (T), the extent of its spread to lymph nodes(N), and its metastasis (M). Combining information about these three variables, gives the stage of cancer — 0, I, II, III, and IV . Higher stage indicates widespread cancer spread. As expected from the above result, we observe that when compared with male breast cancer cases, there is a higher percentage of female breast cancer cases for lower stages and a lower percentage for higher stages.
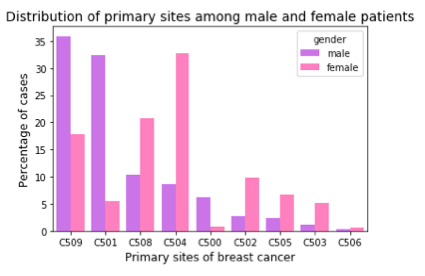
Next, I checked for the site where the primary tumor originated. Male and female patients show significant difference in their most common primary sites of cancer. The figure below presents the distribution of primary sites for male and female patients. Over a third of men show diffuse tumor/multiple tumor over 3/4th or most of the breast (coded 509 in SEER data), while another third of the male cases present tumor in the central portion of breast, which is the area extending 1 cm around areolar region (dark region around the nipple; coded 501). Compared to women, apart from these two sites, men also have a higher percentage of cases where nipple is the primary site (coded 500). For women, the upper outer quadrant of the breast (coded 504) is the most dominant. This is followed by overlapping lesion of breast (coded 508), upper inner quadrant (coded 502), lower outer quadrant (coded 505) and lower inner quadrant (coded 503).
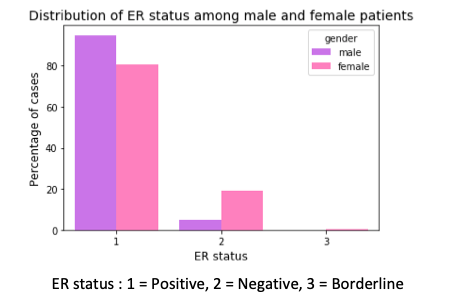
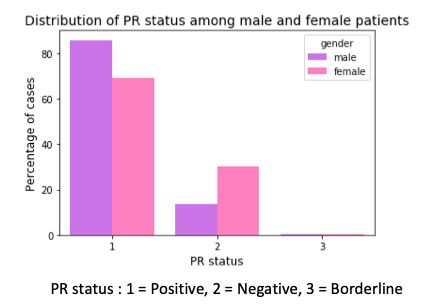
Next, I checked for expression of estrogen and progesteron receptors. There is a higher percentage of male breast cancer cases that are hormone receptor positive. This means that this higher percentage of men can be treated with hormone therapy after their surgery, chemotherapy and radiation, which can help to prevent the return of the disease after the surgery.
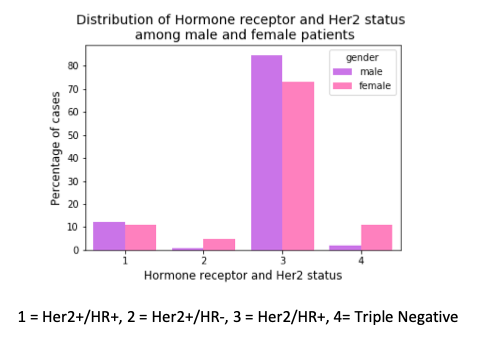
In another finding, there is a higher percentage of female breast cancer cases with triple negative breast cancer than their male counterparts. Triple negative means there is no expression of estrogen and progesterone receptor and no expression of Her2 protein (human epidermal growth factor receptor-2). These tumor grow and spread faster than the other types. In the presence of Hormone Receptor (HR) or Her2, the post-surgery treatment involves drugs that bind to these receptors or Her2 protein. But this strategy cannot be applied in triple negative breast cancers.
Survival analysis for male and female breast cancers
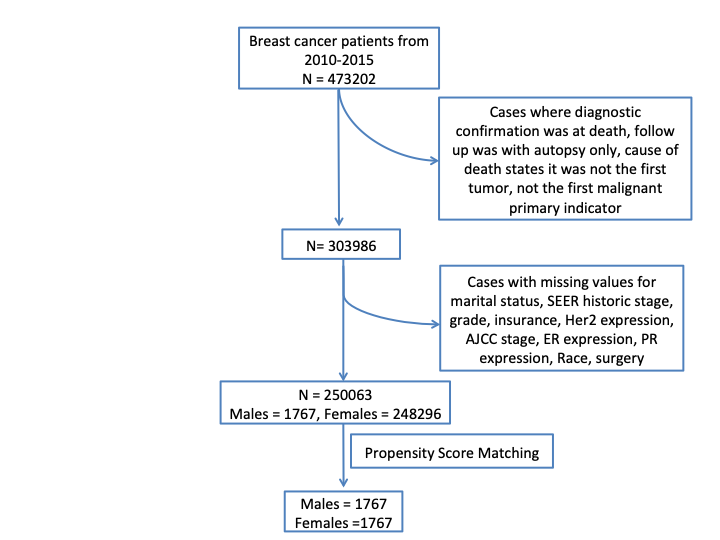
The next question was how does the survival over time looks for both male and female breast cancer patients. To answer this Kaplan-Meier estimate 3 4 and data from 2010-2015 was used. As the SEER data is until 2016, this added an additional follow up of 1 year for cases recorded from 2010-2015. The flow chart shown below, illustrates the screening method employed for the SEER dataset.
The Kaplan-Meier survival curve gives the probability of surviving the given length of time while considering time in smaller intervals. Kaplan-Meier estimate considers data for the patients that dropped out of the study in the midway or even the patients who did not experience the event (in this case the event is death) even until the end of the study or those who joined the study later than its start date. The first two cases are called right-censored observations and we don’t discard these data as they give the information that these cases survived until the last follow-up but we do not know when they die. Kaplan-Meier estimate makes three assumptions – 1). the censored patients at any time have the same prospects as the ones who are continuing in the study , 2). survival probabilities are the same for patients irrespective of their time of recruitment, and 3). event happens at the time specified.
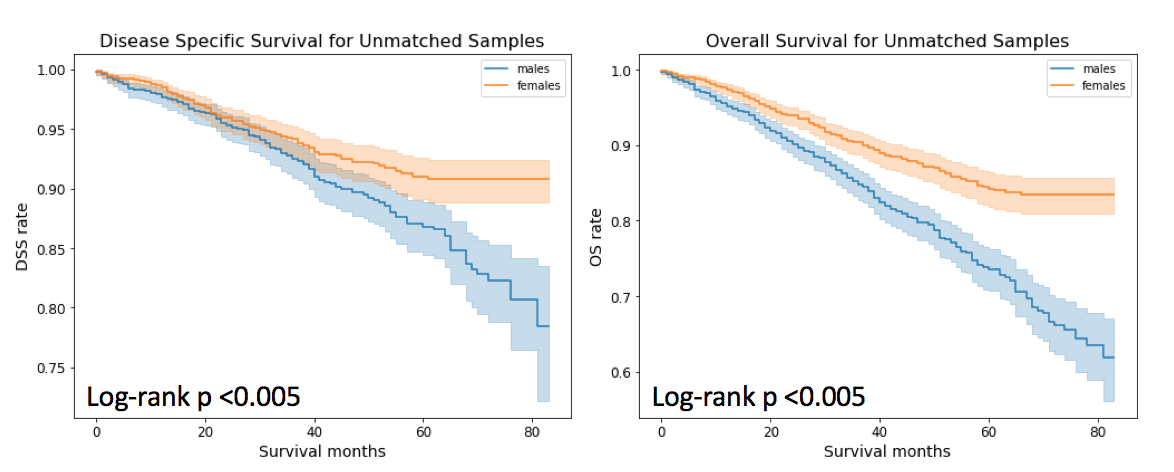
I checked for both disease specific survival (DSS) rate, which in the present study, is the percentage of breast cancer patients who have not died from breast cancer in a given time interval and overall survival (OS) rate which is the percentage of patients who have not died in a given time interval.
As can be noticed that both DSS and OS is higher for female breast cancer patients than their male counterparts. For survival anslysis, python library Lifelines 5 has been used. All P-values less than 0.05 were considered significant.
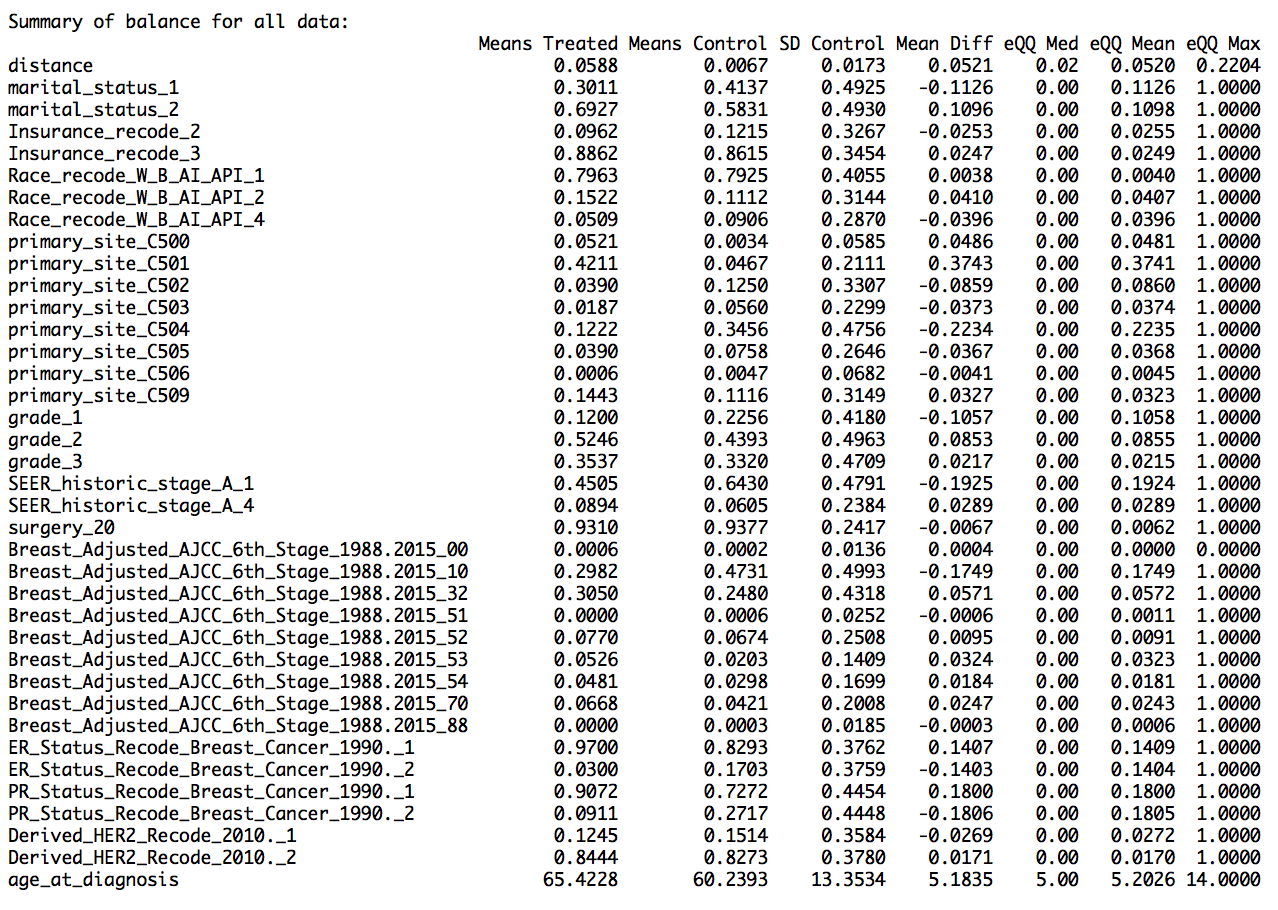
Next, I performed propensity score matching (PSM) using R package MatchIt 6 to remove effects of confounding factors that can affect the comparison of male and female breast cancer survival curves. A propensity score is a probability that a unit (or a case) with given characteristics, belong to the treatment group. Then PSM matches male and female breast cancer cases based on their propensity scores. PSM is based on the assumption that conditional on a few characteristics/variables, treatment group can be compared with the control group as if the treatment is fully randomized. Some of the variables that were matched are – race, age, primary site, cancer grade, SEER historic stage (a simplified staging as explained above) and AJCC staging based on TNM staging, estrogen and progesterone receptors, Her2 protein expression, marital status, and insurance status.
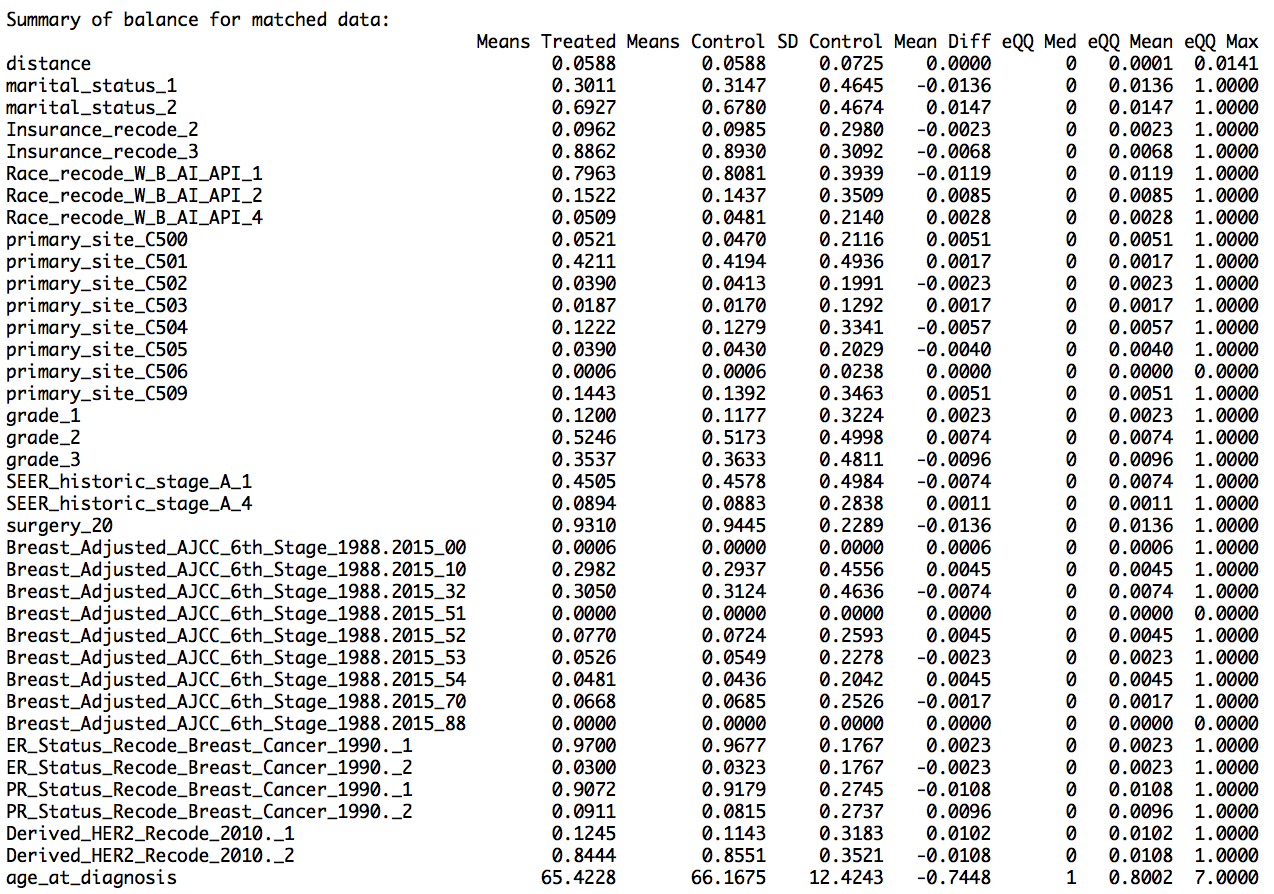
I used nearest neighbor method for PSM, where one-to-one matching was done, that is, each male breast cancer case was matched with its female counterpart. This provided us with 2520 male breast cancer cases and equal number of female breast cancer cases. The results show that the matching worked well, as the mean difference between the treated variables (variables for male cases) and the control variables (variables for female cases) for the matched data was less than that for the unmatched data (shown in the summary report as ‘Summary of balance for matched data’ and ‘Summary of balance for all data’,respectively). In addition, the quartile difference (mean,median,mode) for the matched data showed smaller QQ values, indicating better matching.
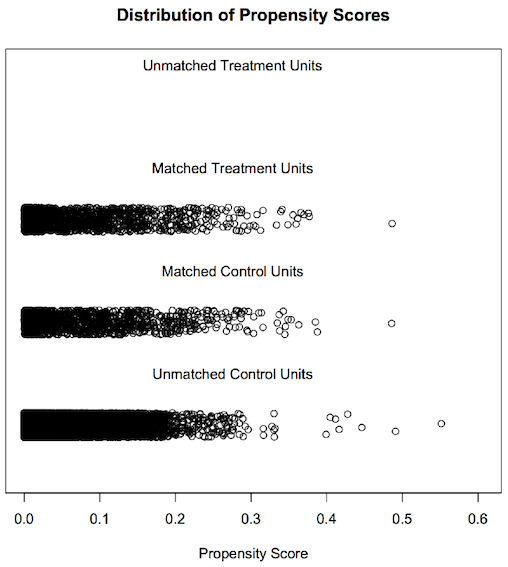
The jitter plot shows circles representing each case’s propensity score. The middle two stratifications show matched treatment and control cases (male breast cancer cases and female breast cancer cases respectively). The lowest jitter stratification shows unmatched female breast cancer cases. As we have used all of male breast cancer cases for the matching purpose, there are no male breast cancer cases in unmatched male treatment units.
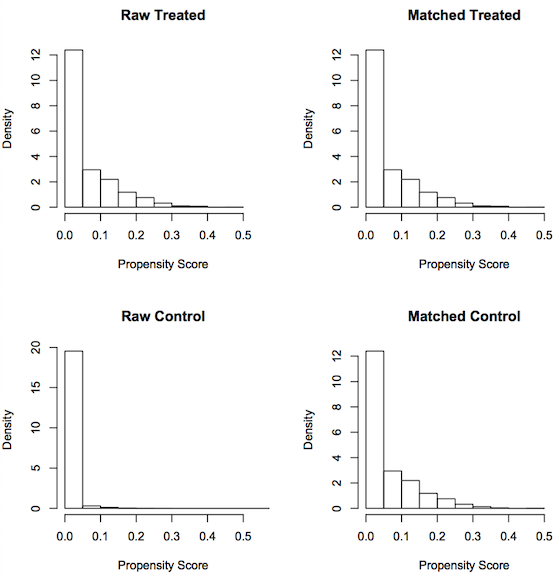
Another graphical representation that is useful here is a histogram. On the left side of the figure, unmatched raw male and female breast cancer cases look very different from the matched male and female breast cancer cases seen on the right.
From the summary data and the graphs, we can say that we have obtained matched data after PSM. The summary report and graphs below show the result of propensity score matching.
Using these matched male and female breast cancer patients, I found no difference in DSS. This result is contradictory to a previously published study 7 that states that men with breast cancer have a better disease specific survival than women with breast cancer. Although the stated study also matched for male and female breast cancer cases but its matching was restricted to ages, date of diagnosis, stage and primary histologic findings. In our study, additional factors such as ER, PR and Her2, TNM stage, surgery, marital status and insurance, have been used for PSM. Thus, availability of these additional confounding factors is a reason that we found no difference in DSS between male and female breast cancer.
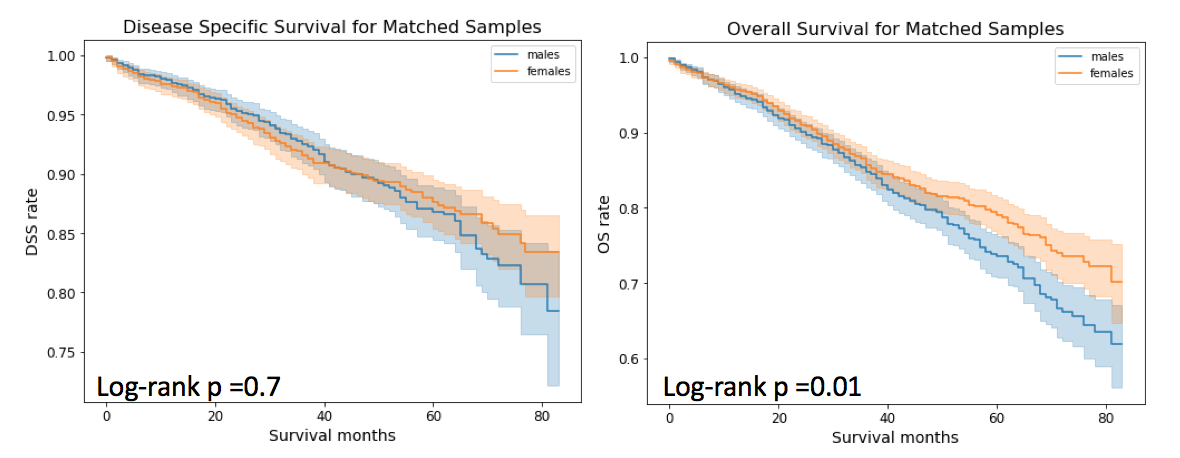
Moving to OS. Although, the difference between survival curves for males and females matched samples is not as drastic as it was for unmatched samples, but there is still some difference observed. In the case of matched samples, 5 year OS for males is 73.61% (95% CI = 76.28% and 70.71%) and for females it is 79.06% (95% CI= 83.37% and 76.51%).
Furthermore, there are 162 male breast cancer deaths which is comparable to 161 female breast cancer deaths for the propensity matched sets. As expected, the total number of male deaths (342) is more compared to female deaths (289). Interestingly, more number of men with breast cancer die from non-breast cancer related deaths such as cardiovascular and cerebroavascular diseases, diabetes mellitus, so on as well as from other cancers such as lung and bronchus, etc. compared to women with breast cancer.
From the suvival analysis, we can conclude that male and female breast cancer specific survival are similar.
In order to comply with the SEER data use agreement, the details of data analysis are not made public. Anyone interested in understanding the methodolgy used here, is welcome to send their queries.
NOTE : As this analysis is not yet peer-reviewed, it SHOULD NOT be used for making decisions related to any medical treatment.
-
https://www.wcrf.org/dietandcancer/cancer-trends/worldwide-cancer-data ↩
-
Howlader N, Noone AM, Krapcho M, Miller D, Brest A, Yu M, Ruhl J, Tatalovich Z, Mariotto A, Lewis DR, Chen HS, Feuer EJ, Cronin KA (eds). SEER Cancer Statistics Review, 1975-2016, National Cancer Institute. Bethesda, MD, https://seer.cancer.gov/csr/1975_2016/, based on November 2018 SEER data submission, posted to the SEER web site, April 2019. ↩
-
Rich, Jason T., J. Gail Neely, Randal C. Paniello, Courtney CJ Voelker, Brian Nussenbaum, and Eric W. Wang. “A practical guide to understanding Kaplan-Meier curves.” Otolaryngology—Head and Neck Surgery 143, no. 3 (2010): 331-336. ↩
-
Goel, Manish Kumar, Pardeep Khanna, and Jugal Kishore. “Understanding survival analysis: Kaplan-Meier estimate.” International journal of Ayurveda research 1, no. 4 (2010): 274. ↩
-
Cameron Davidson-Pilon, Jonas Kalderstam, Noah Jacobson, Paul Zivich, Ben Kuhn, Mike Williamson, … Arturo Moncada-Torres. (2020, May 5). CamDavidsonPilon/lifelines: 0.24.6 (Version 0.24.6). Zenodo. http://doi.org/10.5281/zenodo.3787142 ↩
-
Daniel E. Ho, Kosuke Imai, Gary King, Elizabeth A. Stuart (2011). MatchIt: Nonparametric Preprocessing for Parametric Causal Inference. Journal of Statistical Software, Vol. 42, No. 8, pp. 1-28. URL http://www.jstatsoft.org/v42/i08/ ↩
-
El-Tamer, Mahmoud B., Ian K. Komenaka, Andrea Troxel, Huiling Li, Kathie-Ann Joseph, Beth-Ann Ditkoff, Freya R. Schnabel, and David W. Kinne. “Men with breast cancer have better disease-specific survival than women.” Archives of Surgery 139, no. 10 (2004): 1079-1082. ↩